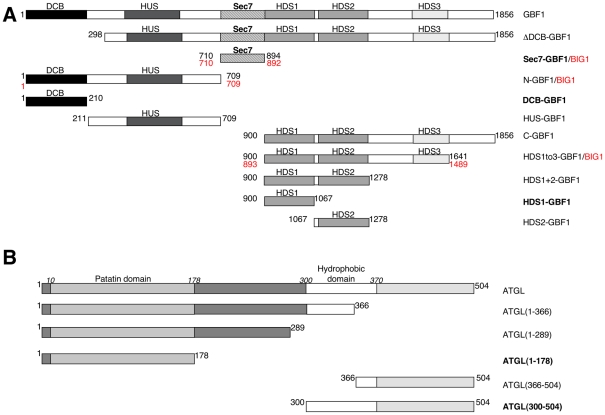
Figure 2. Fragments of Homo sapiens GBF1 and ATGL proteins used in this study.
A- Schematic diagram of GBF1 showing domains, with regions used in the interaction experiments shown below. Amino acid numbers for the beginning and end of each fragment are indicated. Numbers in black are for GBF1, numbers in red refer to BIG1. B- Schematic diagram of ATGL, with regions used in interaction experiments shown below. The constructs indicated in bold are those that were demonstrated to interact directly when expressed in E. coli and were also shown to interact by co-immunoprecipitation and yeast two-hybrid methods (with the exception of the HDS1-ATGL patatin domain interaction which was not detected in yeast two-hybrid); see Table 2 for details. Note that slight variations in the borders of GBF1 constructs were used for the yeast two-hybrid experiments (see Table 1), but essentially the same domains were used for all interaction studies.

