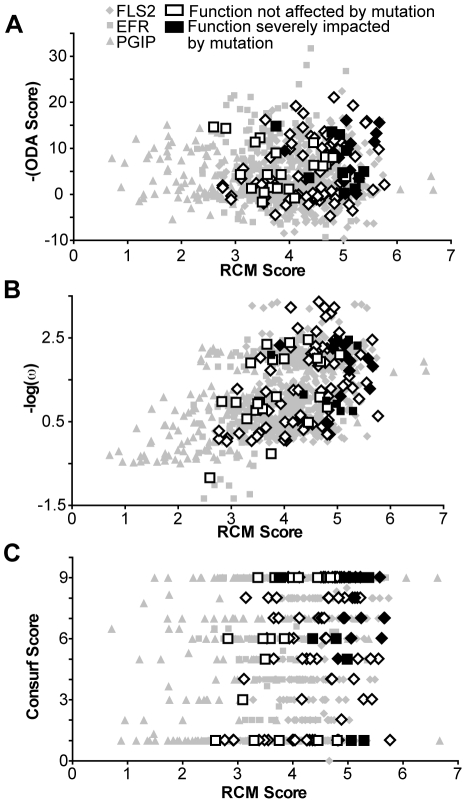
Figure 10. RCM analysis of FLS2, EFR, and PGIP performs as well as other computational methods.
Y-axis: scores for each amino acid according to (A) positive selection analysis (nonsynonymous/synonymous substitution rates); (B) optimal docking area (scale is negative so that more likely docking sites are higher along y-axis); and (C) Consurf; all are graphed with respect to RCM score on the x-axis. Residues that were mutationally tested in the present study or in [35] are indicated as having no significant impact on function (white) or a significant impact on function (black) when mutated. Functional residues (in black) scored significantly higher than non-functional residues (in white) in all analyses completed (T-test; p<.05).

