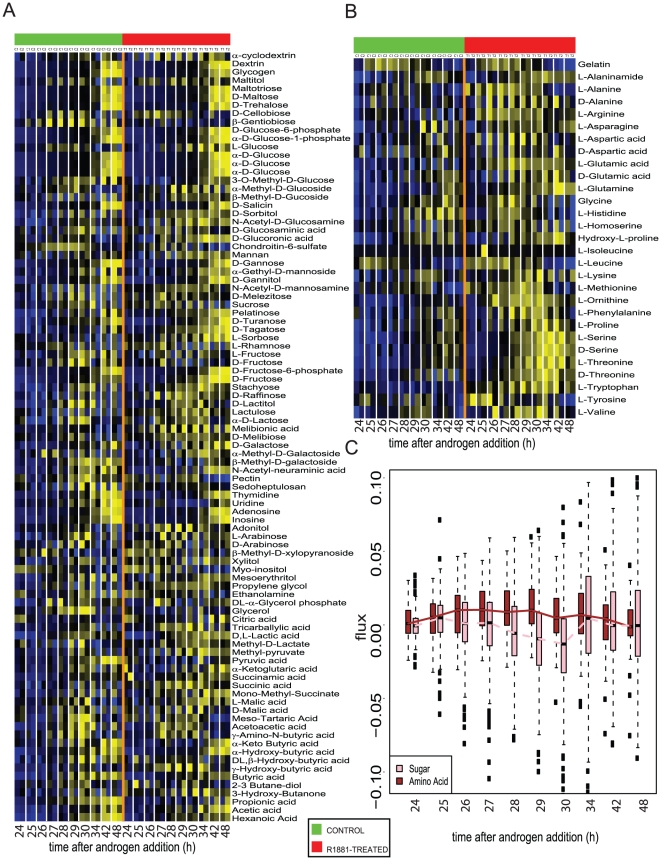
Figure 5. Measurement of metabolic flux in prostate cancer cells upon androgen-treatment.
Heat map showing extent of utilization 86 carbohydrate and nucleotide substrates by prostate cancer cells after 24 h of androgen-treatment. Essentially, 10 nM R1881 (treated for 24 h) or untreated VCaP cells were examined in replicates for their ability to utilize the various nutrient substrates (denoted as pathway activity on Y-axis) at different time points (plotted on X-axis) post-androgen-treatment. The ability to metabolize the nutrients was assessed by calculating the flux of NADH generated which was measured by reading the optical density (OD) at 590 nm. The heat map was generated after background subtraction, log scaling and quantile normalization of the data. Shades of yellow indicate increased activity while shades of blue indicate reduced activity (refer color scale). B) same as in (A), but for utilization of 29 amino acids. C) represents the box plot showing the median flux through the sugar and nucleotide (pink) as well as amino acid (brown) pathways in prostate cancer cells at different time points post-androgen treatment. For each boxplot, the median value is represented by the central, horizontal line; the upper (75%) and lower (25%) quartiles are represented by the upper and lower borders of the box. The upper and lower vertical lines extending from the box represent 1.5 times the inter-quartile range from the upper and lower quartiles.

