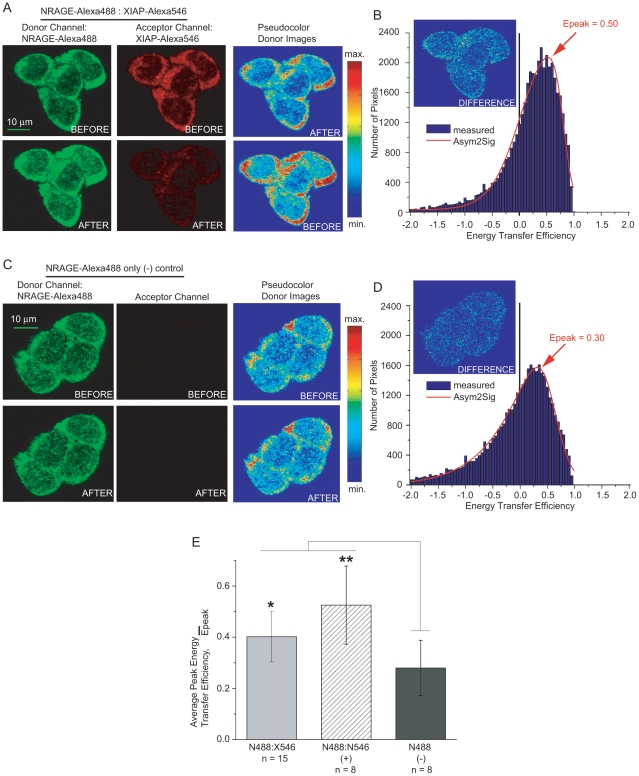
Figure 2. FRET analyses of the endogenous interaction between NRAGE and XIAP in P19 cells.
(A) Confocal images of NRAGE-Alexa488 and XIAP-Alexa546 before and after acceptor photobleaching of Alexa Fluor 546 molecules showing an increase in fluorescence intensity of donor Alexa Fluor 488 molecules also evident by pseudocolor donor Alexa488 intensity images. (B) Asym2Sig fit (red line) of experimental histogram (blue bars) distribution energy transfer efficiencies of the donor images from (A) indicating a peak energy transfer efficiency of 50%. (C) Confocal and pseudocolor intensity images of donor only NRAGE-Alexa488 negative control showing little intensity change. (D) Corresponding histogram (blue bars) and fit (red line) of the negative control indicating a much lower energy transfer efficiency. (E) Average peak energy transfer efficiencies for endogenous NRAGE and XIAP interaction compared to positive and negative controls where *P<0.01 and **P<0.005; n is the number of images each containing 2 to 6 cells. N488, NRAGE-Alexa488; N546, NRAGE-Alexa546; X546, XIAP-Alexa-546.

