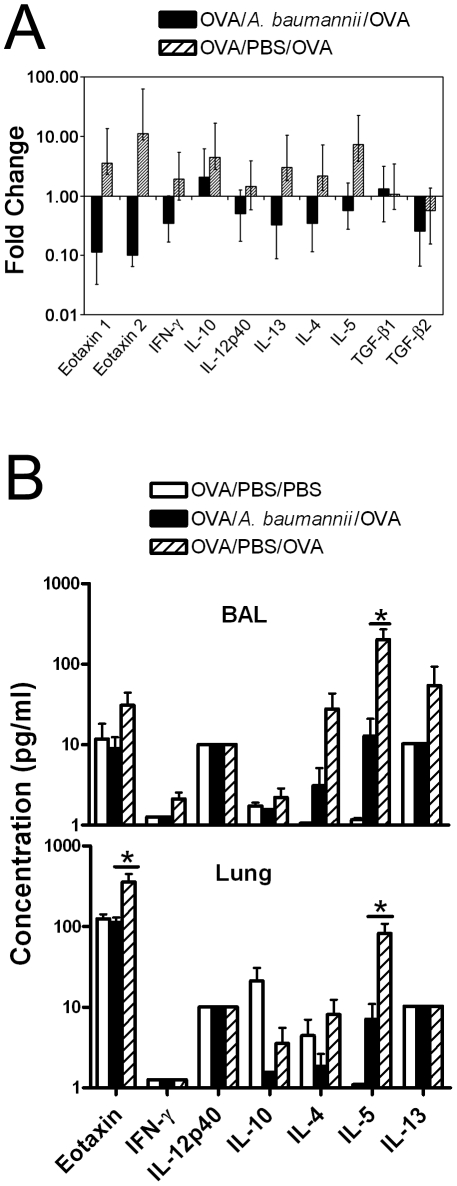
Figure 6. Cytokine responses in the lung and BAL fluid of OVA-sensitized mice following OVA challenge.
(A) Real-time PCR analysis of cytokine mRNA expression in lung tissues in OVA-sensitized and A. baumannii treated mice following i.n. OVA challenge. Mice were sensitized and treated as described in Figure 2 and were euthanized 5 days after i.n. OVA challenge. The lungs were collected for RNA extraction. Relative levels of cytokine mRNA expression were determined by real-time RT-PCR analysis as described in Materials and methods. Mouse β-2 microglobulin RNA was measured and used to calculate relative expression using the formula Rel Exp = 2−(ΔΔCT). Results shown are the average and ranges (error bars) of relative expression values determined using cDNA from A. baumannii- or PBS-treated, OVA challenged mice in relation to the corresponding expression levels in PBS challenged mice (n = 5 for all groups). (B) Effect of A. baumannii infection on cytokine levels in BAL fluid and lung homogenates in OVA-sensitized mice following i.n. OVA challenge. Mice were sensitized and treated as described in Figure 2 and were euthanized 5 days after i.n. OVA challenge. The levels of indicated cytokines in BAL fluid and in the lung homogenate supernatants were measured on a Luminex 100IS system using the Milliplex MAP mouse cytokine/chemokine detection kit (Millipore). Each bar represents the mean pg cytokine/mL ± SD (n = 5). The data are representative of two to three independent experiments. *P<0.05 compared to the PBS-treated group.

