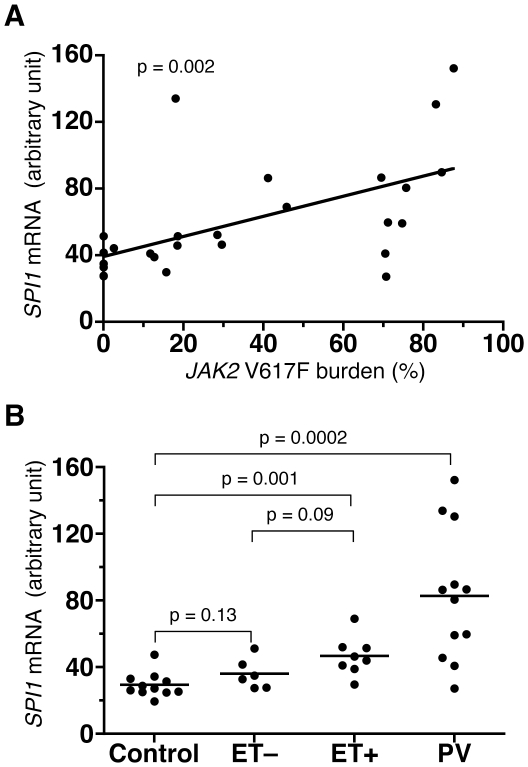
Figure 2. Expression of SPI1 mRNA in MPN patients.
A. SPI1 mRNA levels in peripheral blood of MPN patients determined by qPCR (not PCR array) were calibrated with quantities of HPRT1 mRNA and plotted against JAK2 V617F mutation burden. The values are represented with an arbitrary unit. The line and p value for the slope were calculated based on a linear regression model. B. SPI1 mRNA levels were plotted by disease category. Control represents the healthy volunteers, and ET− and ET+ represent V617F-negative and -positive ET patients, respectively. PV represents PV patients. The p values were calculated by a t-test.

