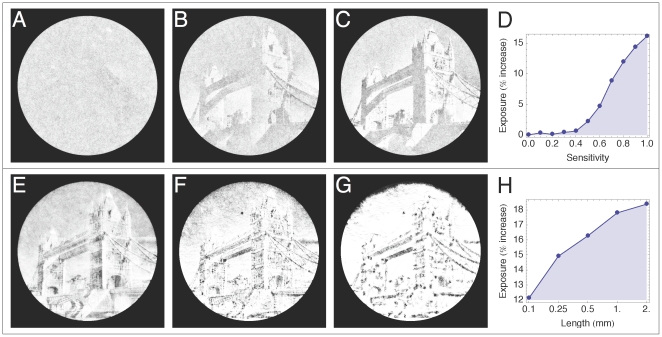
Figure 4. Modeling cyanographs.
Images represent 20 superimposed states of a single simulation. Simulations are run with uniform trichome populations. Each parameter value corresponds to a different simulation. Domain radius is 10 cm. The number of trichomes per simulation depends on the trichome length (the coverage of the domain is fixed) and varies between N = 1.5×10⁴–2.8×10⁵. Standard errors of the mean (SEMs) were very small due to the large sample sizes and are omitted. (A–C) Length and speed fixed to L = 0.5 mm and v = 10 µm.s−1 respectfully; Sensitivity varied between s = 0–1. Images correspond to s = {0.4, 0.7, 0.9} and Sup. Movies S1, S2, and S3 respectively. (D) Graph plotting trichome exposure against trichome sensitivity. The photophobic mechanism starts to become effective from s>0.4. Exposure increases roughly linearly, peaking at a 16% increase for “perfectly” sensitive trichomes. (E–G) Sensitivity and speed fixed to p = 1 and v = 10 m⋅s−1 respectfully; length varied between L = 0.1–2 mm. Images correspond to L = {0.1, 0.5, 2} mm and Sup. Movies S4, S5, and S6 respectively. (H) Log-linear plot of trichome exposure against trichome length (log2 scale).

