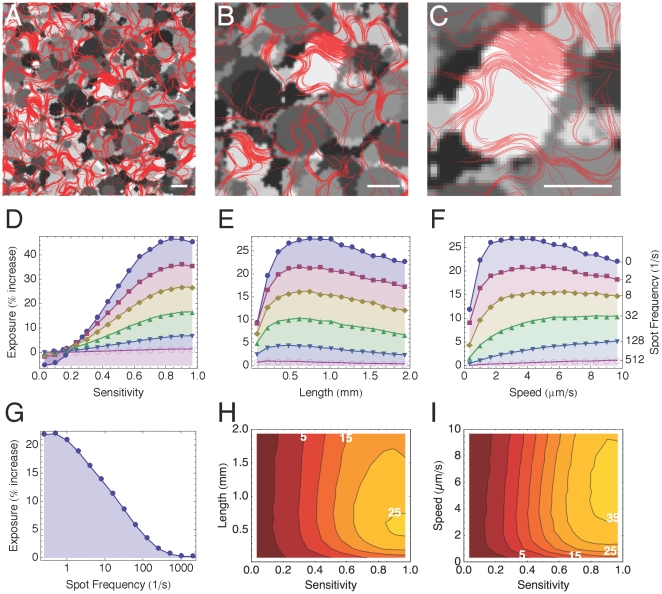
Figure 6. Trichome competition in a dynamic light field.
Same initial conditions as in Figure 5, except a light field composed of overlapping circles of different light intensities is used instead of a static photograph. (A–C) Close ups of a simulation displaying the light field (greyscale) and trichomes (red). See Sup. Movie S7. Every 1/f sec the light intensity of a random spot in the domain is set to a random value I = 0–1. The spots range in diameter between 0.2–2 mm. Scale bars 1 mm. (D–F) Graphs plotting exposure against length (D), sensitivity (E) and gliding speed (F) for six different spot frequencies (0, 2, 8, 32, 128, 512). Different plot colors and symbols correspond to different frequency values, shown on the right-most axis. (G) Plot of average exposure of all trichomes as a function of spot frequency. (H–I) Contour plots demonstrating the relative importance of trichome length vs. sensitivity (H) and gliding speed vs. sensitivity (I). White contour labels indicate percentual exposure increase above average domain light.

