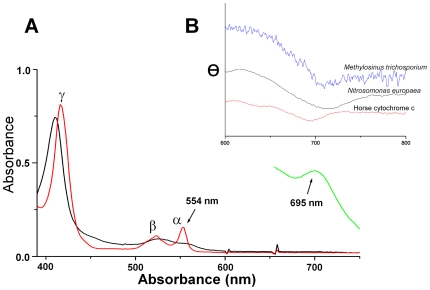
Figure 1. Absorption and CD spectra of cytochrome c-554 from Methylosinus trichosporium OB3b.
A. Visible absorption spectra of a 7 µM solution of the reduced and oxidized cytochrome c-554 from Methylosinus trichosporium OB3b. The α-band in the reduced spectrum has a maximum at 554 nm used to name the cytochrome. The spectrum of a 83 µM solution of the oxidized protein exhibits a peak at 695 nm in the oxidised spectrum is indicative of methionine ligation to the heme. B. Circular dichroism of a 60 µM solution of cytochrome c-554 (magnified 10 times) is compared with a 790 µM solution of cytochrome c-552 from Nitrosomonas europaea and a 200 µM solution of cytochrome c from horse heart. The circular dichroism at the methionine peak shows that the cytochrome c-554 has stronger similarities with cytochrome c-552 from Nitrosomonas europaea than cytochrome c from horse heart.

