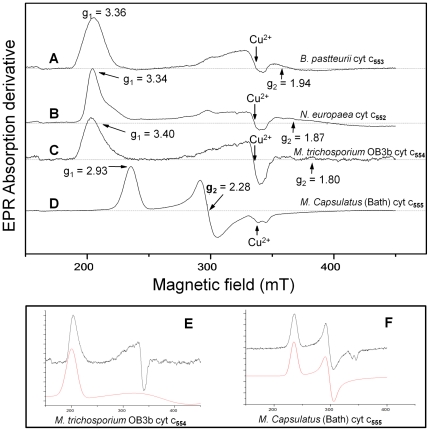
Figure 4. EPR spectroscopy of c-type cytochromes.
X-band EPR spectra of cytochromes c from: A. Bacillus pasteurii (cytochrome c-553) [44], B. Nitrosomonas europaea (cytochrome c-552) [44], C. Methylosinus trichosporium OB3b (cytochrome c-554), and D. Methylococcus capsulatus (Bath) (cytochrome c-555). The protein solutions were prepared in 50 mM HEPES buffer at pH 7.5, and the spectra were recorded in perpendicular mode at 10 K with 2 mW microwave power, modulation amplitude 1 mT, modulation frequency 100 kHz, sweep time 168 s, time constant 82 ms and 4×10⁴ gain. E. Simulation of the HALS EPR spectrum C (red). F. Simulation of the rhombic EPR spectrum D (red).

