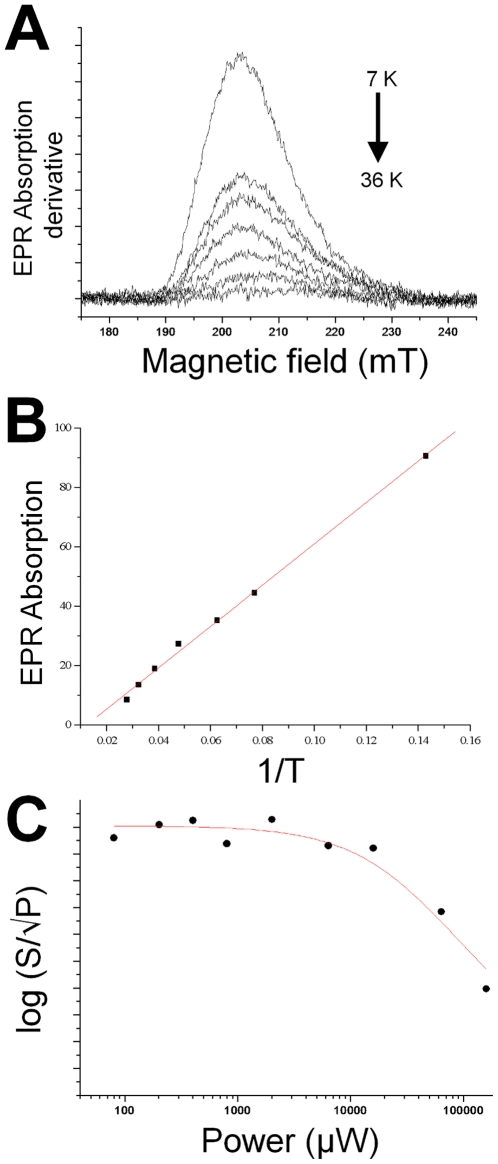
Figure 5. Temperature and microwave-power behaviour of the EPR signal of cytochrome c-554 from Methylosinus trichosporium OB3b.
A. Temperature dependence of the HALS EPR spectrum. The spectra were recorded at 800 µW and the temperatures were 7, 13, 16, 21, 26, 31 and 36 respectively. B. The double integral of g-max plotted against the inverse temperature (1/T). The line represents the linear fit according to the Curie-law. C. Power saturation of the EPR spectrum. S equals the double integral of g-max, and P is the microwave power. The line is a simulated power saturation behaviour assuming a b-value of 1, indicating a P½ value of 44 mW. The spectra were recorded in perpendicular mode with modulation amplitude 1 mT, modulation frequency 100 kHz, sweep time 168 s, time constant 82 ms and 4×10⁴ gain.

