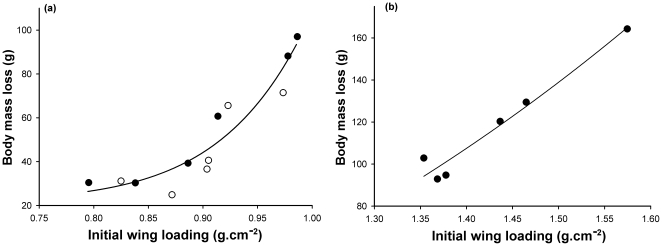
Figure 2. Body mass loss and initial wing loading.
Relationship between body mass loss (g) and initial wing loading (g.cm− 2) for the three disturbance sessions in disturbed groups in teals (a) and tufted ducks (b) (values plotted are means). In teals, individuals in G1 and G2 are indicated by open and closed circles, respectively. The relationship is best described by y = 85.31×12.86+21.92, R2 = 0.88, F2,11 = 37.36, p<0.0001 in teals and by y = 58.68×2.77−41.65, R2 = 0.93, F2,5 = 34.73, p = 0.008 in tufted ducks. The results indicate that body mass loss was higher when the initial wing loading was high.

