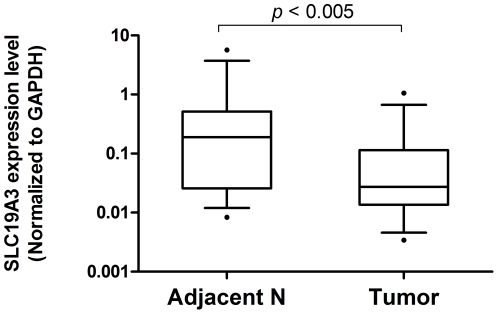
Figure 1. Down-regulated SLC19A3 gene expression in primary breast cancer tissues.
Relative SLC19A3 mRNA expression between tumor tissues and their paired adjacent non-tumor breast from breast cancer patients (n = 15) by real-time qPCR. Expression of SLC19A3 mRNA (Log10 scale at Y-axis) was normalized to GAPDH. The lines inside the boxes denote the medians. The boxes mark the interval between the 25th and 75th percentiles. The whiskers denote the interval between the 10th and 90th percentiles. Statistical difference was analyzed by Wilcoxon test, P<0.005.

