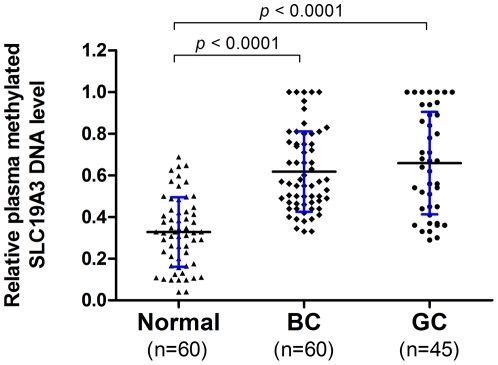
Figure 4. Quantitative analysis of plasma methylated SLC19A3 DNA on a group (n = 165) of plasma samples by MSRED-qPCR.
Scatter plots of plasma levels of methylated SLC19A3 DNA in 60 healthy normal subjects, 45 gastric cancer (GC) and 60 breast cancer (BC) patients. Plasma level of methylated SLC19A3 DNA is expressed as 2ΔCt(undigest-digest). ΔCt(undigest-digest) is calculated by subtracting the Ct values of digested plasma DNA from the Ct values of undigested plasma DNA. Since Ct of undigest should be ≤Ct of digest, the expression level is ranging from 1 to 0. The horizontal black lines denote the means. The blue errors bars denote the ± standard deviations (SD). Statistically significant differences were determined using Mann-Whitney U tests, P<0.0001.

