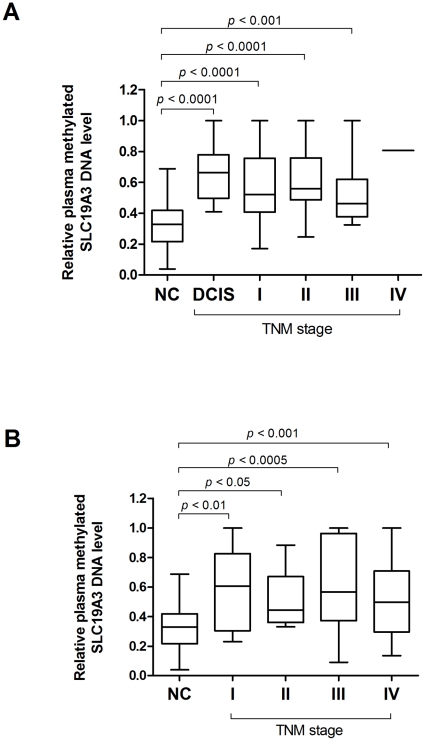
Figure 6. Plasma methylated SLC19A3 DNA levels across tumor stages from both Phase I and II validation.
(A) Box plot of plasma methylated SLC19A3 DNA level in 80 NC, 27 ductal carcinoma in situ (DCIS) plus 71 BC patients across various TNM stages. (B) Box plot of plasma methylated SLC19A3 DNA level in 80 NC and 65 GC patients across various TNM stages. The box represents the interquartile range and the line across the box indicates the median value. Relative plasma level of methylated SLC19A3 DNA is expressed as 2−ΔCt(Dig-Undig). ΔCt(Dig-Undig) is calculated by subtracting the Ct values of digested plasma DNA from the Ct values of undigested plasma DNA. Statistically significant differences were determined using Mann-Whitney tests.

