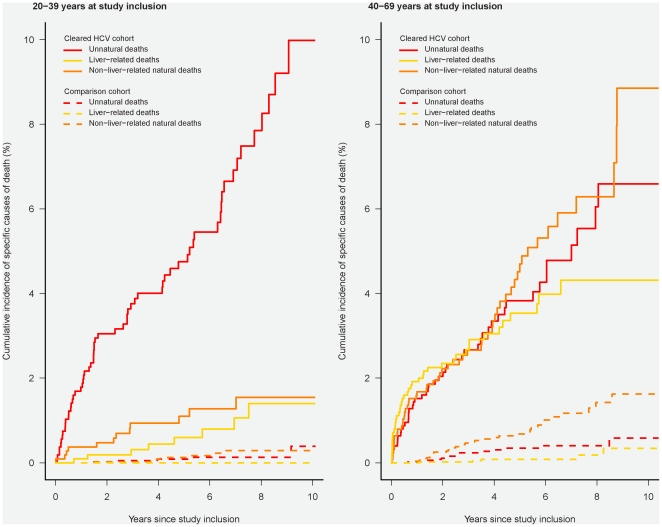
Figure 3. Cumulative incidence function illustrating cause-specific mortality in patients with cleared HCV-infection and an age- and gender-matched comparison cohort without comorbidity, alcohol abuse or IDU, according to age at study inclusion.
Solid line: Patients with cleared HCV-infection; broken line: Individuals from the comparison cohort. The left-hand graph illustrates survival in individuals aged 20–39 years at study inclusion; the right-hand graph illustrates survival in those aged 40–69 years at inclusion.

