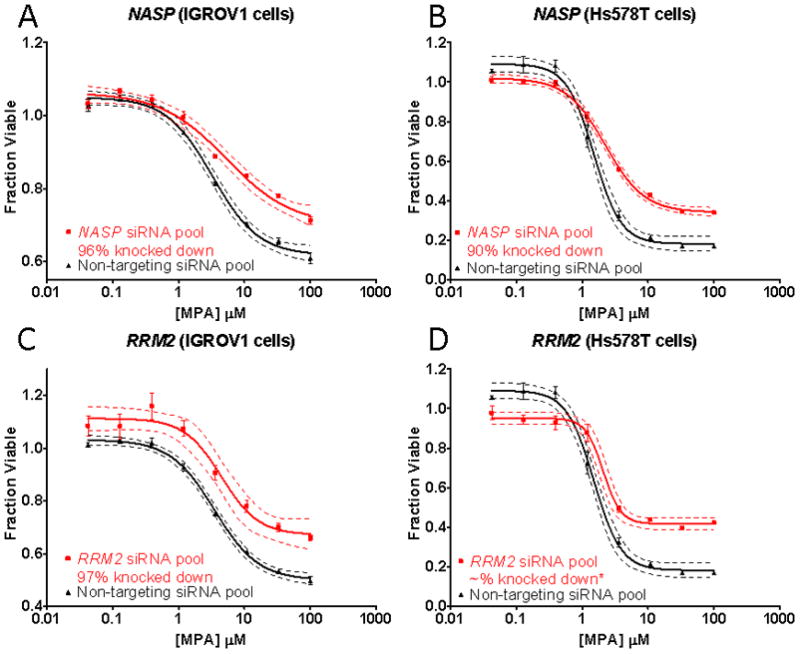
Fig. 5.

Candidate gene functional validation using IGROV1 and Hs578T cells. (A) NASP functional validation in (A) IGROV1 cells and (B) Hs578T cells. (C) RRM2 functional validation in IGROV1 cells and (D) Hs578T cells. Each of the cytotoxicity curves was performed in triplicate. Bars represent the SEM, and dashed curves represent 95% confidence intervals for each cytotoxicity curve. *We were unable to perform qRT-PCR assays to determine RRM2 mRNA levels because of insufficient template.
