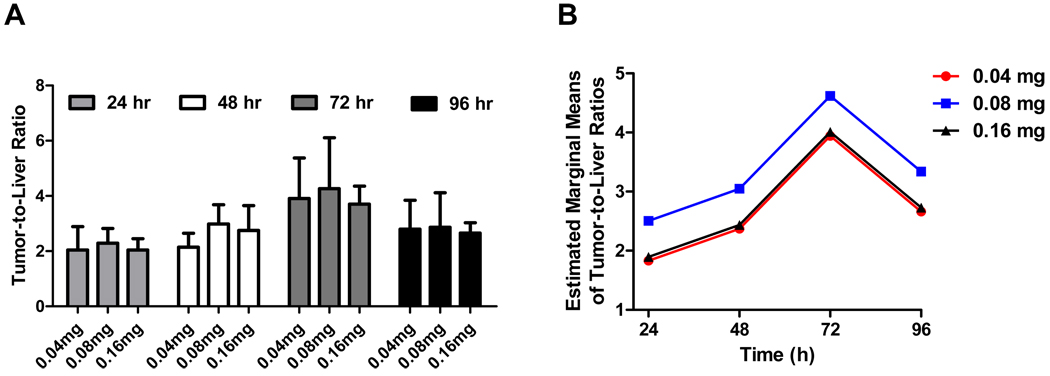
Figure 2. Dose of ICG and timing of intraoperative imaging.
A. Fluorescent intensity of the liver in 18 rats injected with 0.04, 0.08 or 0.16 after 24, 48, 72 and 96 h.
B. Fluorescent intensity of all liver tumors (N = 34) in 18 rats injected with 0.04, 0.08 or 0.16 mg ICG after 24, 48, 72 and 96 h.
C. Average tumor-to-liver ratios and standard deviations are plotted for all liver metastases (N = 34) in 18 rats injected with 0.04, 0.08 or 0.16 mg ICG after 24, 48, 72 and 96 h.
D. Estimated marginal means of tumor-to-liver ratio for rats injected with 0.04, 0.08 or 0.16 mg ICG after 24, 48, 72 and 96 h using the repeated measures ANOVA and least square difference (LSD) adjustment for multiple testing. This model showed that the tumor-to-liver ratio was significantly higher in the 72 h time group compared to the 24 h (P < 0.001), 48 h (P = 0.001) and 96 h (P = 0.004) time groups. ICG dose did not significantly influence tumor-to-liver ratios, but a trend was found favoring the 0.08 mg dose group (0.08 vs. 0.04, P = 0.06; 0.08 vs. 0.16, P = 0.09).

