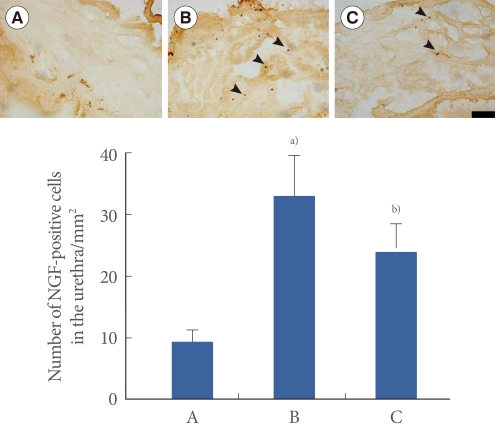
Fig. 2.
Effect of swimming on nerve growth factor (NGF) expression in the urethra. Upper: Photomicrographs of NGF-positive cells in the urethra. The sections were stained for NGF-like immunoreactivity (brown). Arrows indicate NGF-positive cells. The scale bar represents 200 µm. Lower: The mean number of NGF-positive cells in each group. (A) Sham-operation group, (B) Transabdominal urethrolysis-induced group, (C) Transabdominal urethrolysis-induced and swimming group. The results are presented as the mean±SEM. a)P<0.05 compared with sham-operation group. b)P<0.05 compared with transabdominal urethrolysis-induced group.

