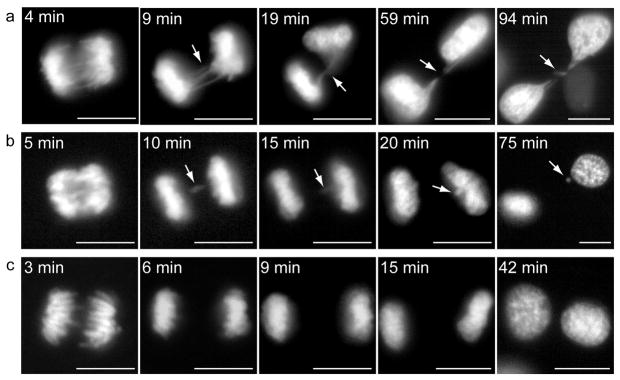
Figure 2. Chromosome segregation defects in Ski−/− MEFs.
Mitotic Ski−/− and Ski+/−MEFs stably expressing a GFP-H2B fusion protein were analysed in vivo by time-lapse microscopy. Several z-stacks were acquired every five minutes. The most informative “t” and “z” frames were selected. (a) Chromatin bridges (arrows) in a Ski−/− cell leading to loss of genetic material. (b) Lagging chromosome (arrows) in a Ski−/− cell leading to micronucleus formation. (c) Normal chromosome segregation in a Ski+/− cell. Time, in minutes (min.), indicates time since anaphase starting. Scale bars: 10 μm. Movies showing the complete process are available as Supplementary videos (S1 and S2).

