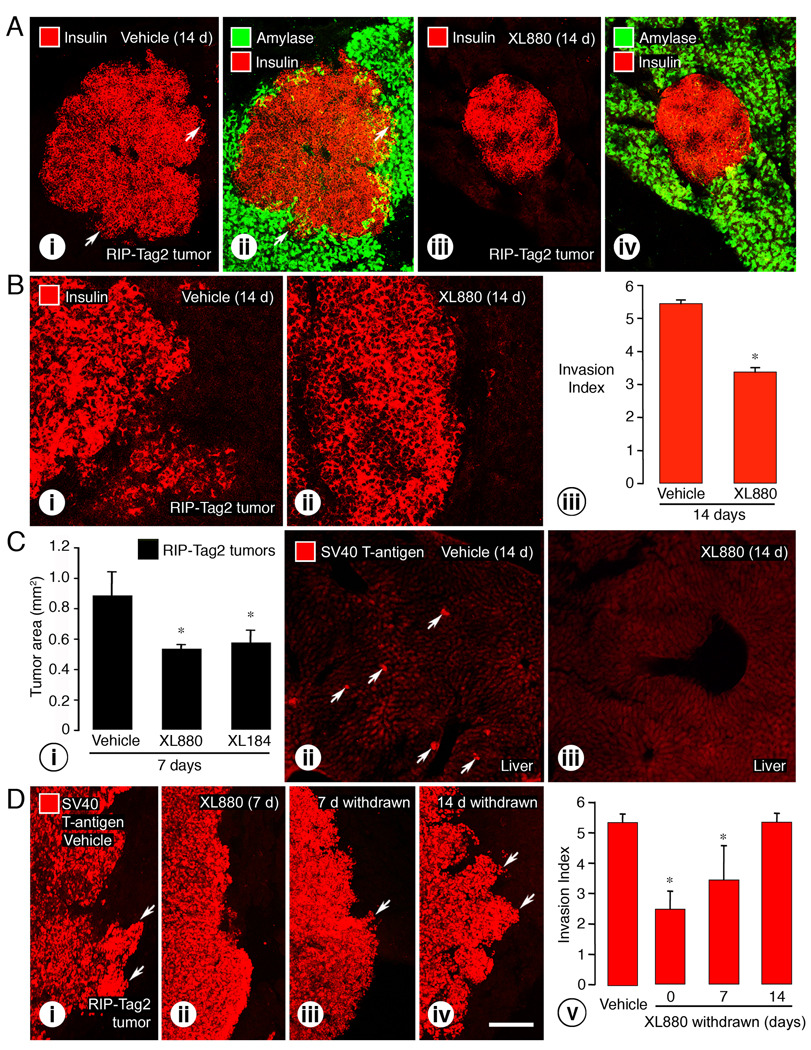
Figure 6. Treatment-related differences in tumor invasiveness, size, and liver metastases.
Confocal micrographs of RIP-Tag2 tumors. Ai–ii, irregular border (arrows) of tumor after vehicle. Aiii–iv, smooth contour of tumor after XL880 for 14 days. Tumor cells stained for insulin (red) and surrounding exocrine pancreas stained for amylase (green). Bi–iii, measurements show significant reduction in irregularity of tumor border, reflected by Invasion index, after XL880 for 14 days. Ci, measurements of histological sections show significant reductions in size of RIP-Tag2 tumors after treatment with XL880 (40%) or XL184 (35%) for 7 days, from age 10 to 11 weeks. Cii–iii, scattered tumor cells (arrows) marked by SV40 T-antigen immunoreactivity are shown in the liver of 12-week-old RIP-Tag2 mouse after vehicle, but no stained cells after XL880 for 14 days. Di, irregular tumor border after vehicle (arrows). Dii, smoother tumor border after XL880 for 7 days. Diii, smooth border with small projects at 7 days after withdrawal of XL880 (arrows). Div, greater irregularity of tumor border (arrows) at 14 days, which is similar to but not more severe than baseline. Dv, Invasion index measurements show the magnitude of changes in tumor border irregularity before and after withdrawal. * P < 0.05 vs. vehicle. Scale bar: 150 µm (A); 55 µm (B); 180 µm (C); 50 µm (D).

