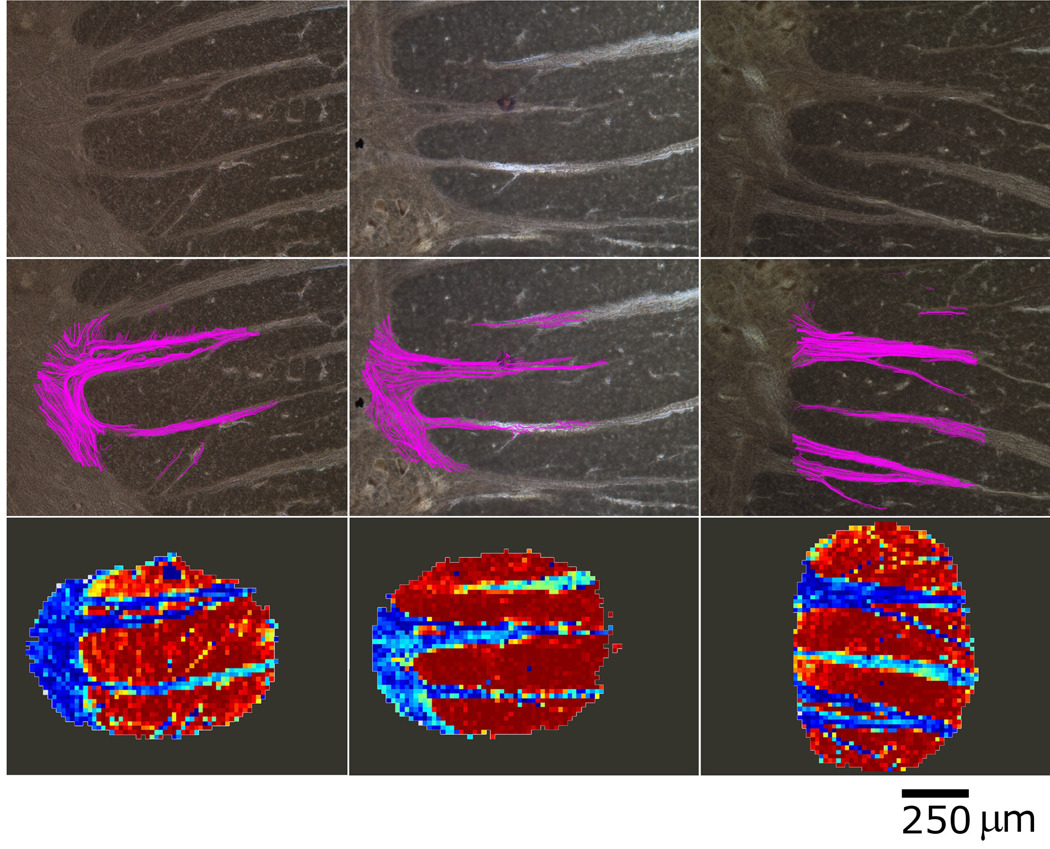
Figure 4.
Three example datasets of Black-Gold II stained histology (top row) and their corresponding superimposed tractography overlays (middle row). Note the different structural contrast obtained with the Black Gold II stain which exhibits specific binding to myelin structures compared to the Nissl stain used for neuronal labeling employed in figures 2 and 3. The bottom row shows the variation in the component of the primary eigenvector orthogonal to the image plane (through-plane). Blue colors represent the smaller components while warmer colors represent the larger. This component of the primary eigenvector is seen to reflect tissue structure closely. In this manner, all three components of the primary eigenvector (two in-plane used in the DTT, and the through-plane component in the bottom row) are shown graphically to contain precise structural information matching the histology. The DC values for these sets are from left to right: 0.82, 0.95, 0.89.

