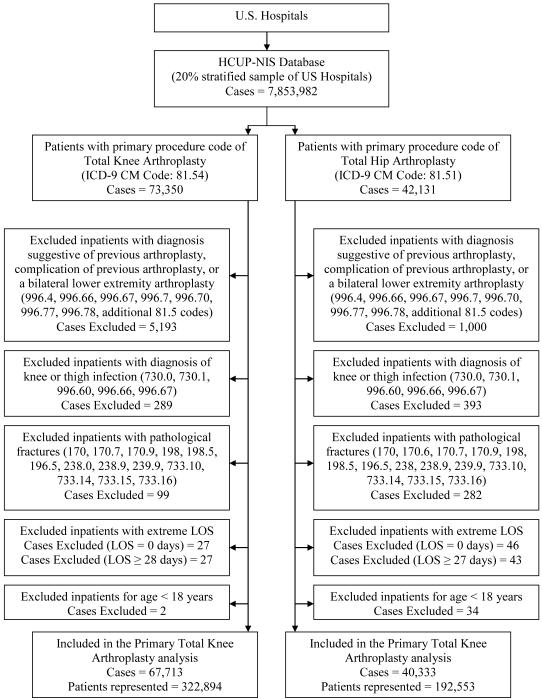
Figure 1.
Schema of Case Inclusion and Exclusion
The figure is a schematic representation of how the HCUP-NIS data file was pruned to two separate data files consisting of the primary TKR and THR cases. Arrows represent the step by step progression of exclusion, noting the number of cases excluded at each step, prior to obtaining the final set of cases meeting all inclusion and exclusion criteria.

