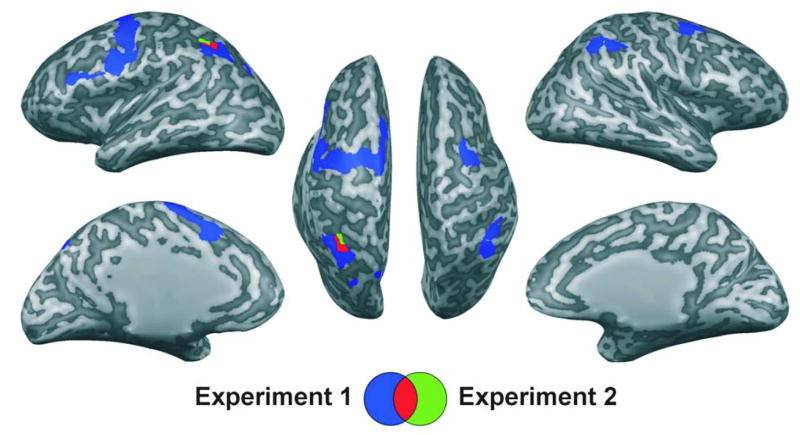
Figure 3.
Conjunction across all available low vs. high load condition contrasts in both experiments. Experiment 1, in blue, reflects brain regions demonstrating greater activation for the 4vis condition as compared to the 2vis condition in conjunction with greater activation for the 2vis2aud as compared to the 2vis condition [(4vis>2vis) && (2vis2aud>2vis)]. Experiment 2, in green, reflects the conjunction of four different contrasts: the same ones as in the first experiment plus contrasts in which the low-load condition comprised two spoken letters [(4vis>2vis) && (2vis2aud>2vis) && (4vis>2aud) && (2vis2aud>2aud)]. Overlap of the resulting two maps (shown in red) revealed a single region centered in the left intraparietal sulcus (x=−27, y=−46, z=31). Results are viewed on the inflated surface of an exemplar brain. In all instances, p < .05, false-discovery-rate corrected.

