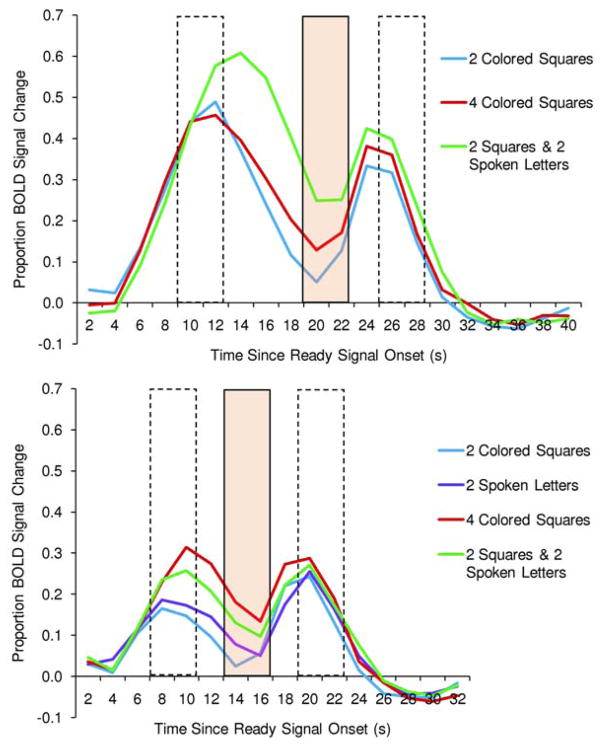
Figure 4.
In a key brain region, percent BOLD signal change from a pre-trial baseline for each condition, over time within the trial. This BOLD activity comes from the left intraparietal sulcus as defined by the area of overlap between conjunction analyses in the two experiments (red area in Figure 3). (A) Experiment 1. (B) Experiment 2. In each experiment, the first broken-line box depicts the time period used as an index of encoding; the shaded box, maintenance; and the second broken-line box, responding.

