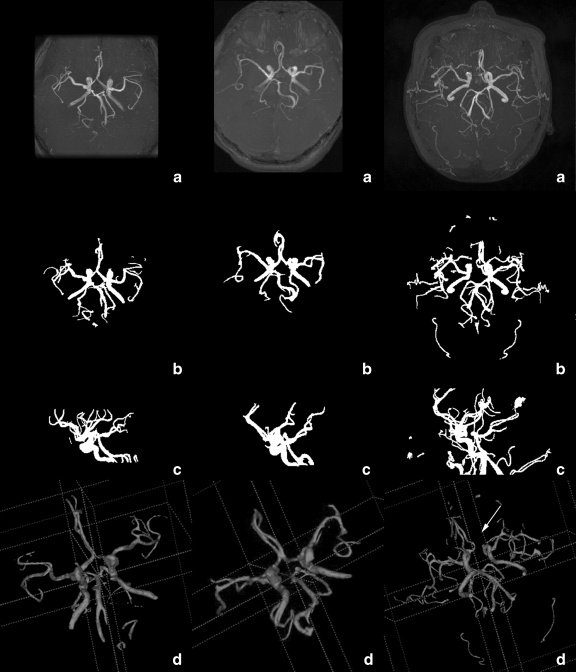
Fig. 6.
Volume visualizations of the segmented region. Rows 1–3 are the KH, GHSH, and GUH datasets, respectively. a Axial MIP images of the raw dataset, b and c axial and sagittal MIP images of the segmentation results, d 3-D rendered images of the segmentation results. Illumination: arrow marks an abnormal broken vessel caused by occlusion.

