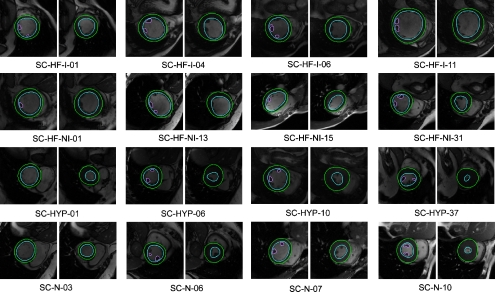
Fig. 7.
Some segmentation outputs by our method; each row presents one pathology group study. The first row presents heart failure with ischemia studies, the second row shows the heart failure with no ischemia cases, the third row contains hypertrophy cases, and the last row presents normal cases. Four datasets are present in each group. For each dataset, two resulting images are shown. The left one is the image of the ED phase and the right one of the ES phase. The names below the image data are from the data source. Papillary muscles are segmented on ED images whenever possible.

