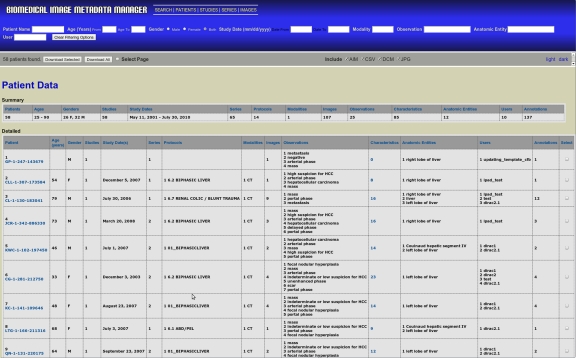
Fig 2.
Representative summary table page (http://bimm.stanford.edu/patients). The user can generate custom datasets and views using the filtering options available within the blue banner. Customized datasets are downloadable, using buttons and checkboxes within the gray bar below the blue banner, in several formats. Selecting multiple options applies all filters in combination to generate custom datasets. Applying multiple options provides a cumulative effect on the resulting table.

