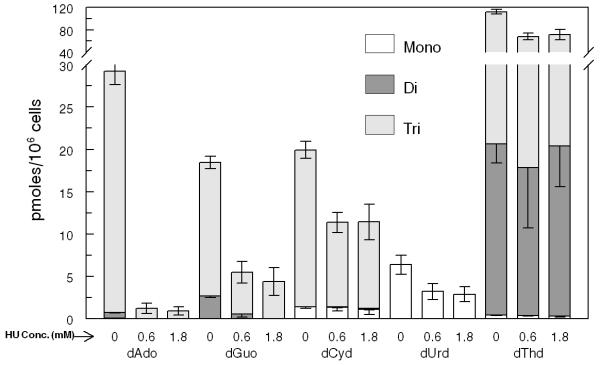
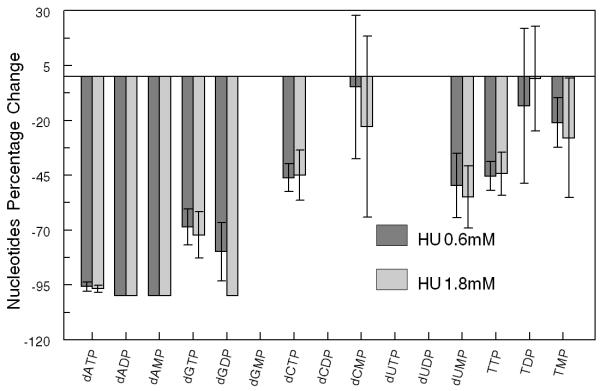
Figure 3.
(A) Representative profile of deoxyribonucleotides (dRNs) in PANC1 cells treated without and with hydroxyurea (HU) − 0.6 (1×ID50) and 1.8 mM (3×ID50). (B) Percent decrease in dRNs after treatment of PANC1 cells with 0.6 and 1.8 mM of HU. Each data point is an average of two independent experiments (done in triplicate) and is reported as mean ± standard deviation.


