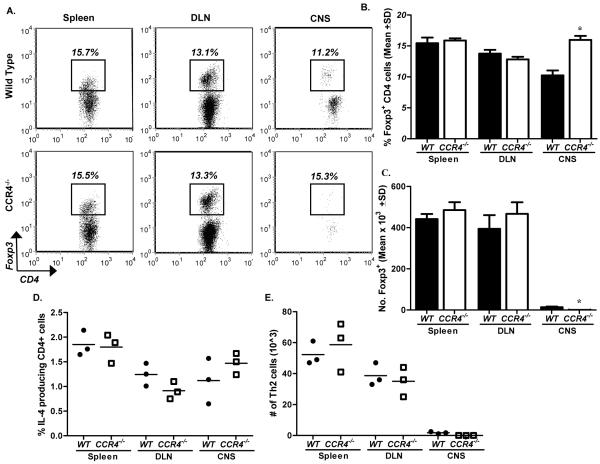
Figure 5. Treg and Th2 numbers remain unaltered in CCR4−/− mice.
Immunized WT and CCR4−/− mice were killed at the onset of WT clinical disease. Treg and Th2 numbers were assessed by intracellular flow cytometric analysis. (A) Representative flow dot plots of Foxp3 expression in the periphery and spinal cord of WT and CCR4−/− animals. The data is derived from a combined forward versus side-scatter and CD45+CD4+ gate. (B) Mean percentage (±SD) of CD4+ cells expressing Foxp3 and (C) quantification of the mean number (±SD) of CD4+Foxp3+ cells in the periphery and spinal cord of each group. (D) Mean percentage (±SD) of CD4+ cells expressing IL-4 and (E) quantification of the mean number (±SD) of CD4+IL-4+ cells in the periphery and spinal cord of each group. The data is representative of two experiments, n=3 mice/group. *, p<0.05.

