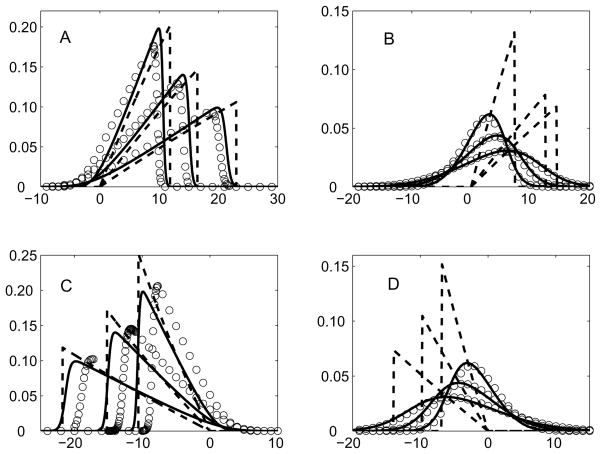
Fig. 3.
Comparison of the normalized concentration φ (y-axis) as a function of (x − vt)/σ 0 (x-axis) obtained from the full solution, Eq. (13) (open circles), Eq. (22) (solid lines) and Eq. (42) or Eq. (51) (dashed lines) at fixed instants of time vt/σ0 = 50, 100 and 200. The parameters are: P = 62.7: α = 0.5 (Panel A), α = −0.5 (Panel C) and P = 5.0: α = 0.5 (Panel B), α = −0.5 (Panel D).

