
Fig. 3.
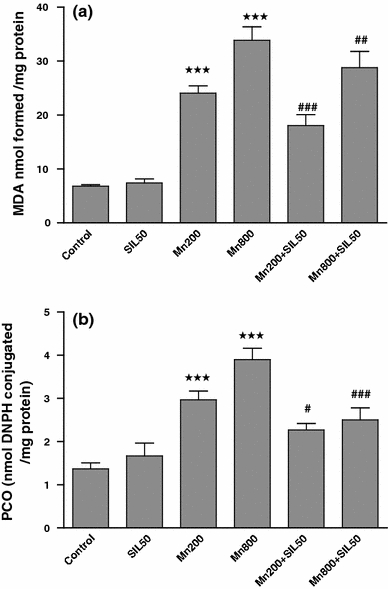
The effects of the Mn exposure (200 and 800 μM) and/or SIL (50 μM) on MDA and protein carbonyl levels in Neuro-2A lysates. MDA are expressed as nmol formed/mg protein and protein carbonyl (nmol DNPH conjugated/mg protein). Results represent mean ± SD (n = 6). *P < 0.05, ** P < 0.01, *** P < 0.001 versus vehicle control group. # P < 0.05, ## P < 0.01, ### P < 0.001 versus Mn-treated alone group