
Fig. 1.
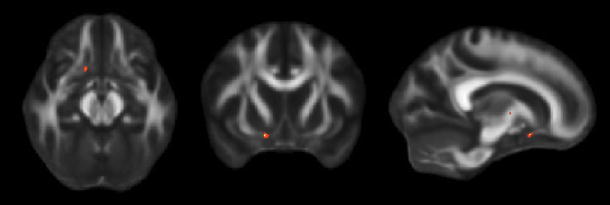
Mean FA images in axial, coronal and sagittal view showing significantly reduced FA in patients compared with controls in the right temporal lobe subcortical fibres of the inferior fronto-occipital fasciculus
Official websites use .gov
A
.gov website belongs to an official
government organization in the United States.
Secure .gov websites use HTTPS
A lock (
) or https:// means you've safely
connected to the .gov website. Share sensitive
information only on official, secure websites.
Mean FA images in axial, coronal and sagittal view showing significantly reduced FA in patients compared with controls in the right temporal lobe subcortical fibres of the inferior fronto-occipital fasciculus