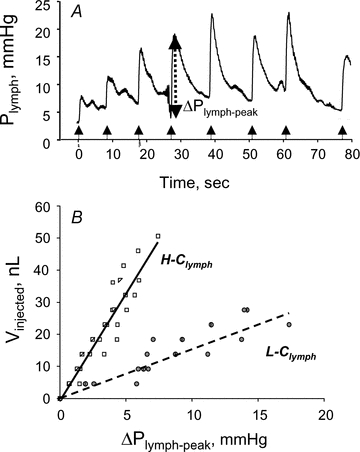
Figure 5. Pressure–volume behaviour of submesothelial diaphragmatic lymphatics.

A, time course of Plymph from the pre-injection value at t = 0 and during sequential injections of 4.6 nl of lissamine green saline solution. At each injection Plymph sharply increases by ΔPlymph-peak to attain a peak value followed by a slower Plymph decay to pre-injection values (modified from Moriondo et al. 2010). B, relationships obtained by pooling data from several measurements in different diaphragmatic submesothelial vessels, where the cumulative injected volume, Vinjected, is plotted as a function of ΔPlymph-peak. The data points appear distributed in two distinct populations characterized by a significantly (P < 0.05) different Clymph amounting to 6.7 nl mmHg−1 (high compliance, H-Clymph) and 1.5 nl mmHg−1 (low compliance, L-Clymph), respectively (modified from Moriondo et al. 2010).
