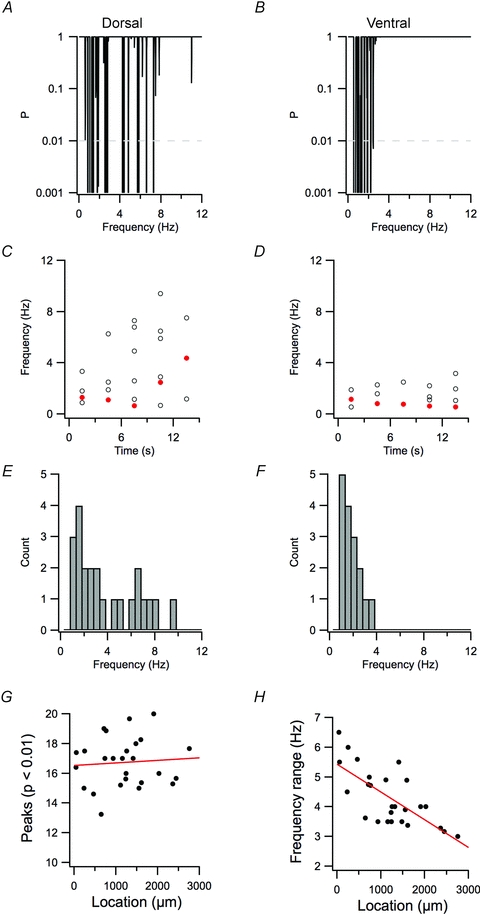
Figure 4. Modulation of relatively high-frequency spectral peaks causes dorsal–ventral organization of perithreshold membrane potential activity.

A and B, examples of periodograms of 15 s of perithreshold membrane potential activity from dorsal (A) and ventral stellate neurons (B). C and D, frequencies of significant peaks (P < 0.01) for contiguous 3 s segments of data from A and B, respectively. The frequencies of the peak with the highest significance in each epoch are indicated in red. E and F, distribution of frequencies for the significant peaks in A–D. G and H, the mean number of peaks in each 15 s epoch (G) and the range of frequencies spanned by the significant peaks (H) are plotted as a function of the dorsal–ventral position of each recorded neuron. For number of peaks, R2= 0.036, P = 0.71. For frequency range, R2= 0.49, P = 4.4e–5.
