
Figure 5. Block of Ih reduces the maximal frequency of perithreshold oscillatory activity.
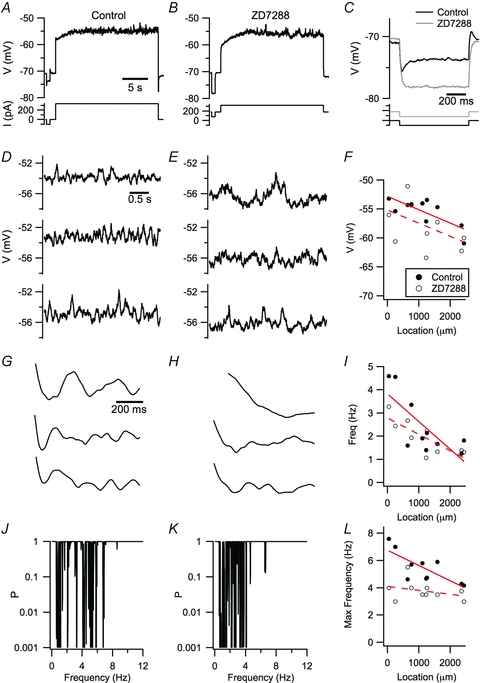
A and B, examples of perithreshold membrane potential responses of a stellate neuron to current steps before (A) and during perfusion of 10 μm ZD7288 (B). C, the amplitude of voltage responses to negative current steps is increased and the membrane potential sag is abolished by ZD7288. To compensate for the hyperpolarization of the membrane potential induced by ZD7288, a constant positive offset current is injected into the neuron. D and E, the three 3 s segments of activity with the largest autocorrelation scores obtained from the responses in A and B. Selection of the segments is as in Giocomo et al. (2007). G and H, autocorrelation functions for the data in D and E. J and K, Lomb periodograms obtained from the data in A and B. F, I and L, perithreshold membrane potential (F), frequency of autocorrelation peaks (I) and frequency range (L) of the significant peaks in the Lomb periodogram before (filled circles) and during perfusion of ZD7288 (open circles) is plotted as a function of dorsal–ventral location of the recorded neuron. The most depolarized membrane potential was reduced by ZD7288 (P = 0.047, Student's paired t test; P = 0.063, ANCOVA), while the dependence on location (P = 0.0498, ANCOVA) was not significantly altered (P = 0.98, ANCOVA). The autocorrelogram peak frequency was not significantly affected by ZD7288 (P = 0.14, Student's paired t test; P = 0.13, ANCOVA), while the peak frequency depended on location (P = 0.0030, ANCOVA). The Lomb frequency range depended on location (P = 0.00014) and was affected by ZD7288 (P = 0.0047), while the number of Lomb peaks did not depend on location (P = 0.54) and was not affected by ZD7288 (P = 0.43).