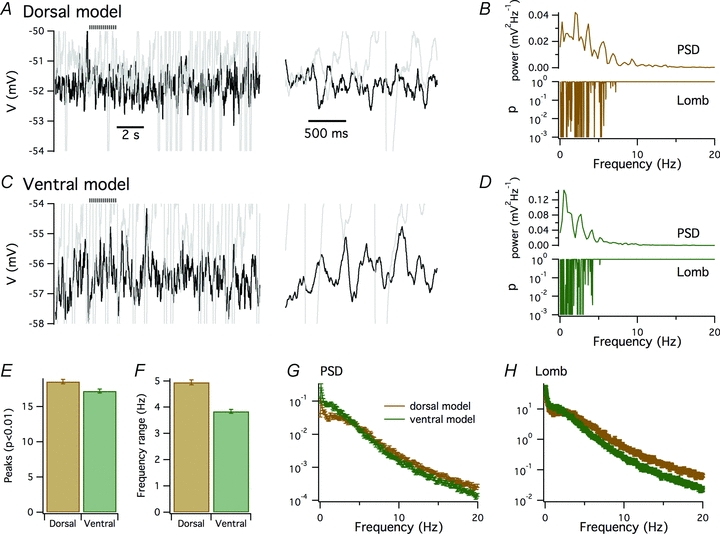
Figure 6. Tuning of HCN and leak K+ channels in a stochastic stellate neuron model accounts for dorsal–ventral organization of perithreshold activity.

A–D, examples of perithreshold membrane potential (A and C) and corresponding plots of power spectral density and significance of peaks in the Lomb periodogram as a function of frequency (B and D) obtained from dorsal (A and B) and ventral configurations (C and D) of a stochastic model of an MEC stellate neuron. Perithreshold membrane potential responses are to injection of 465 (A and B) and 90 pA current steps (C and D). Traces in grey are the just suprathreshold responses to 470 (A and B) and 95 pA current steps (C and D). The horizontal striped bar indicates the regions shown on an expanded time scale to the right. E–H, the mean number of significant (P < 0.01) peaks in the Lomb periodogram (E), the mean range of frequencies at which significant peaks occurred (F), the mean power spectral density (G) and the mean Lomb periodogram (H) obtained from 100 simulations of the dorsal (brown) and ventral configurations (green) of the stellate neuron model. The dorsal neurons had on average more significant peaks (P = 0.002, Student's unpaired t test) and a wider range of peak frequencies (P = 0.7e–17, Student's unpaired t test) compared with the simulated ventral neurons. Comparison of power spectral density and Lomb periodogram data points at 0.5 Hz intervals indicated that perithreshold membrane potential fluctuations generated by the dorsal model had less power (P < 0.05, Student's unpaired t test comparison of individual data points) at frequencies below 3 Hz and more power (P < 0.05) at frequencies >5 Hz compared with the ventral model.
