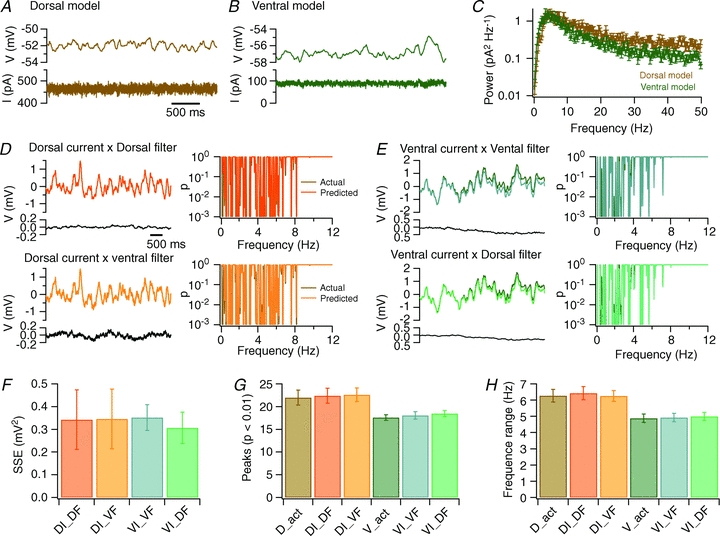
Figure 7. Dorsal–ventral organization of oscillatory activity is accounted for by differences in stochastic membrane currents.

A and B, examples of membrane potential (upper traces) and total membrane current (lower traces) obtained from simulation of perithreshold membrane potential activity of a stellate neuron model in dorsal (A) and ventral configurations (B). C, average power spectral density of perithreshold membrane current fluctuations from dorsal and ventral configurations of the stellate neuron model. Each spectrum is the mean of 10 spectra calculated from the total ionic current as in (A and B). D and E, comparison of the membrane potential predicted by multiplying current input with a filter, with the actual membrane potential (upper traces). The difference voltage is calculated by subtracting the predicted from the actual membrane potential (lower traces). Corresponding Lomb periodograms are shown to the right. The membrane potential and corresponding Lomb periodograms from the dorsal model (D) and the ventral model (E) are well predicted by multiplying currents generated by the dorsal model with filters generated from either the dorsal or the ventral model as indicated. Scale bars and labelling of traces in D and E are identical. In several panels, the simulation result is obscured because it is almost identical to the result predicted by convolving the filter with the current input. F, the sum of the squared errors (SSE) between the actual voltage and the voltage predicted by multiplying the perithreshold ionic current generated by the dorsal (DI) or ventral model (VI) with a filter obtained from previous simulations with a dorsal (DF) or a ventral neuron (VF). G and H, the number of significant peaks (G) and the range of significant frequencies (H) generated by simulation of the dorsal (D_act) or ventral (V_act) models, or calculated as in D and E (symbols as in F). ANOVA indicated that the number of significant peaks and the range of significant peaks were independent of the identity of the filter (P = 0.95 and P = 0.97, respectively), but depended on the origin of the input current (P = 9.0e–6 and P = 1.9e–6). Subsequent Student's paired t tests also indicated significant differences between membrane potential fluctuations driven by currents from dorsal and ventral models (P < 0.05 in all cases) and absence of a significant difference (P > 0.3) between potential fluctuations driven by the same currents and different filters.
