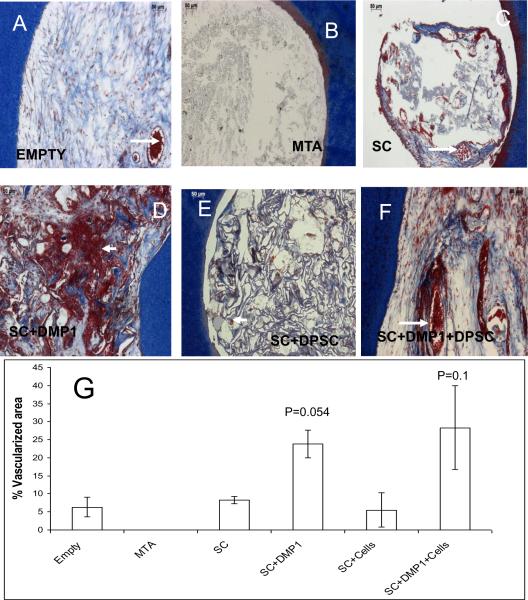
Figure 3. Histological staining by Masson's trichrome to evaluate connective tissue deposition and neovascularization.
Images A–F represents the different experimental groups as labeled. Arrows point to red blood corpuscles indicating presence of blood vessels. (G) Is a graphical representation of the percentage of perforation area covered by the presence of blood vessels. Data represented as mean +/− s.e.m. p represents the p-value obtained from students t-test.

