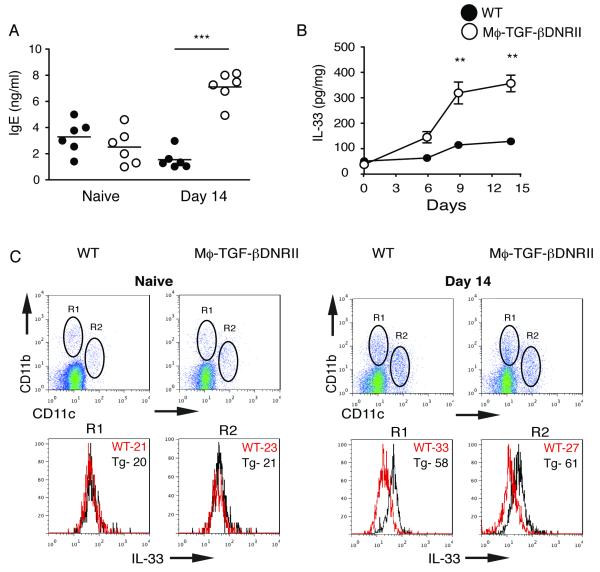
Figure 6.
Measurement of IgE levels and IL-33 within the colon following DSS induced colitis in production in WT and CD68TGF-βDNRII mice. (A) Serum IgE levels were measured in naïve and DSS-treated mice at day 14. (n=6) Experiments repeated twice. *=p<0.05, **=p<0.01 as determined by Student t test. (B) Measurement of IL-33 levels in colon tissue from WT and CD68TGF-βDNRII mice over the course of colitis induction. (n=6) Closed circles (WT) and filled circles (transgenic) that represent mean ± SE are shown. (C) Intracellular staining for IL-33 on CD11b+ and CD11b+CD11c+ gated populations from the colon lamina propria of naïve and DSS-treated mice at day 14. Histograms show mean fluorescence intensity of staining for IL-33 (n=3) Experiments repeated twice.

