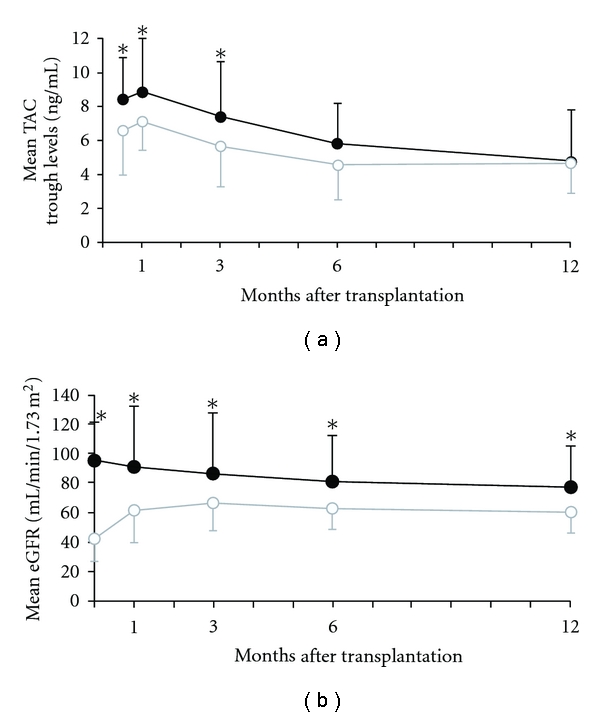
Figure 2.

Kinetics of mean trough levels of tacrolimus and mean estimated glomerular filtration rate (eGFR) in the RI group and non-RI group during the first year after transplantation. (a) Mean trough levels of tacrolimus in the non-RI group (black line) and RI group (gray line). (b) Mean estimated glomerular filtration rate (eGFR) in the non-RI group (black line) and RI group (gray line). Data are median ± SD of values. *P < 0.05.
