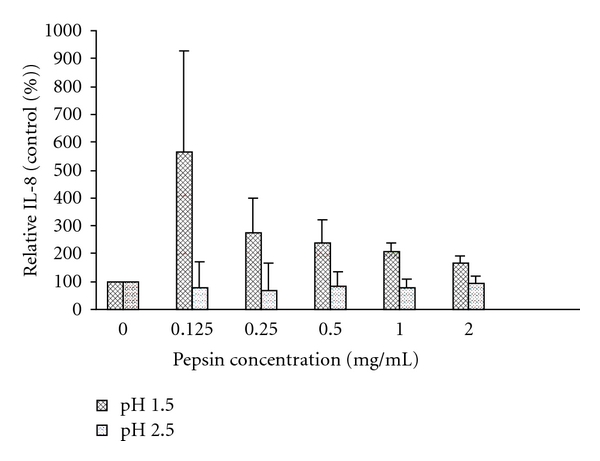
Figure 5.

Interleukin-8 production by 16-HBE cells, corrected for cell proliferation and expressed as a % of exposure with the corresponding pH without pepsin (control). Interleukin-8 release induced by pepsin is higher at pH 1.5 compared to pH 2.5 (mean difference 221%; P < 0.01). Data expressed as mean (histograms) and SEM (bars) for 3 replicates. See supplement Figure 3 for induction of IL-8 at all pepsin concentrations and pH levels used in the statistical analysis.
