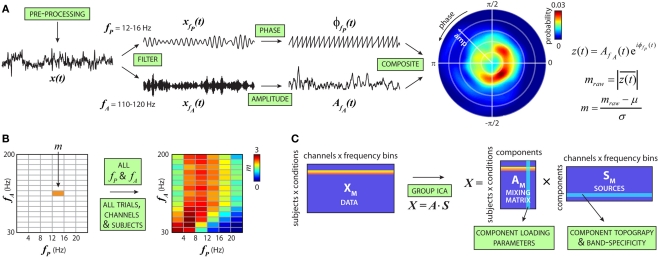
Figure 1.
Schematic of cross-frequency modulation analysis. (A) Steps to compute the cfM index (m). AOD trials are pre-processed and filtered into low-frequency bands [e.g., fP = 12–16 Hz, forming xfP(t)] and high-frequency bands [e.g., fA = 110–120 Hz, forming xfA(t)]. Analytic phase, φ(t), and amplitude envelope, A(t), are extracted from xfP(t) and xfA(t), respectively, to form a composite signal: z(t) = A(t)eiφ(t). Coupling between low-frequency phase and high-frequency amplitude is present if the probability distribution of z(t) is circularly non-uniform, equivalently, if the length of z(t), , is different from zero. Raw modulation indices are transformed into z-scores based on a null distribution from surrogate datasets. (B) Steps in (A) are repeated for all fP and fA combinations to produce the comodulogram. This is repeated over trials, conditions (target, novel or standard stimuli), EEG channels, and subjects to generate the full dataset. (C) For each subject, comodulograms are averaged over trials and data from all channels are concatenated to form a single row for each condition. Vertical concatenation of these rows forms the data matrix (XM). ICA estimates a mixing matrix (AM) and set of independent components (SM) from XM. The columns of AM indicate the loading parameters or weights of a particular component for each subject and condition. The rows of SM correspond to the component topography and spectral composition.

