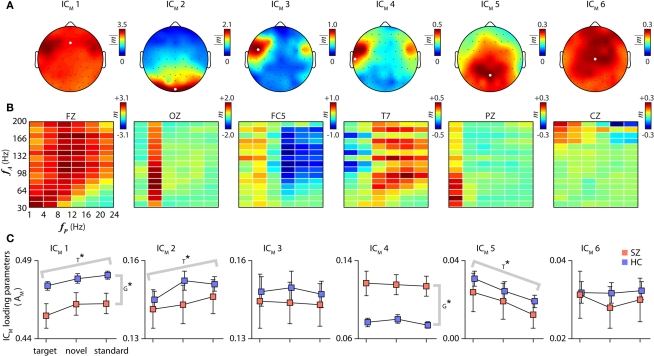
Figure 2.
Cross-frequency modulation components. Component scalp topographies (A), spectral comodulograms (B), and loading parameters (C). The scalp distribution of each component is identified using the amplitude of the modulation index from the frequency bin with the greatest average amplitude over channels. Comodulograms in (B) are displayed for a single representative channel, indicated by the white dots in (A). As indicated by the color scales adjacent to each panel, the magnitudes of cfM vary greatly between components; components are listed in decreasing order of their variance. (C) Component loading parameters for each condition stratified by SZ (red) and HC (blue) groups (REL subjects not shown). Error bars in this and all subsequent plots denote ± 1 SEM. T* and G* indicate significant differences over conditions or groups, respectively, as determined with a repeated measures one-way ANOVA (P < 0.05, Bonferroni corrected for 6 tests).

