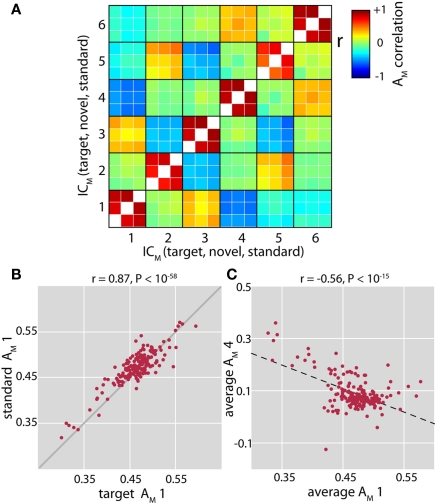
Figure 4.
Relationships between cross-frequency modulation loading parameters. (A) Full correlation matrix between loading parameters (AM) for each cfM component and each condition (target, novel and standard stimuli). In general, component weights are well correlated between conditions (values along the diagonal). (B) Example of correlation between loading parameters of target tones and standard tones for ICM 1. Solid gray line indicates unity. (C) Negative correlation between the loading parameters of ICM 1 and ICM 4. Here, the loading parameters have been averaged over condition. Dashed black line shows the least-squares linear fit to the data.

