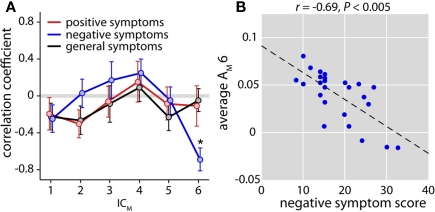
Figure 5.
Relationship between cross-frequency modulation and patient symptoms. (A) Plot of correlation coefficients between ICM loading parameters (averaged over condition) and positive (red), negative (blue), and general (black) symptom scores. Only patients with PANSS scores collected within 2 weeks EEG acquisition were included in this analysis (n = 25). Error bars ( ± 1 SEM) estimated with 1000 bootstrap resamplings. A single significant correlation (indicated by the asterisk, after Bonferroni correction for 18 tests) was found between negative symptoms and ICM 6 (r = −0.69, P < 0.005). (B) Scatter plot of negative symptom scores and the loading parameters of ICM 6. Dashed black line represents the least-squares linear fit.

