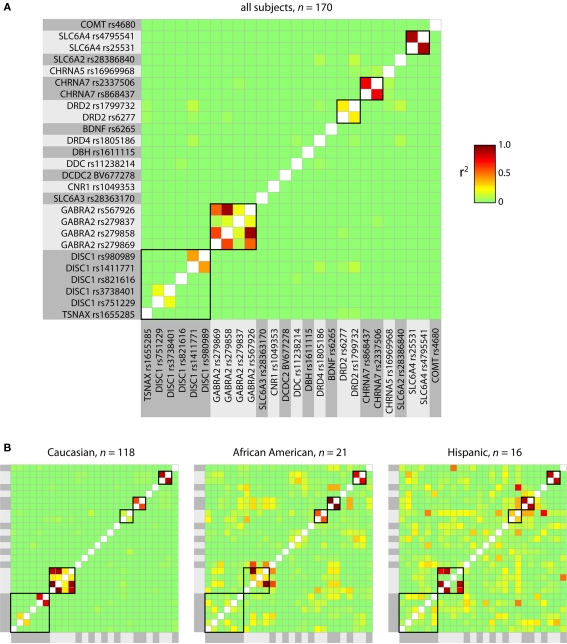
Figure A1.
Correlation structure for the genotyped polymorphisms. (A,B) r2 values computed between all pairs of loci. High correlations indicate data redundancy, which is reduced through ICA. Polymorphic loci in close physical proximity are bounded with black boxes. Correlation structure is displayed for all subjects in (A), and in (B) is computed separately for the 3 largest subsets of subjects identifying as Caucasian (left, n = 118), African American (middle, n = 21), and Hispanic (right, n = 16). Correlation structure is similar between groups, though differences in magnitude are evident.

