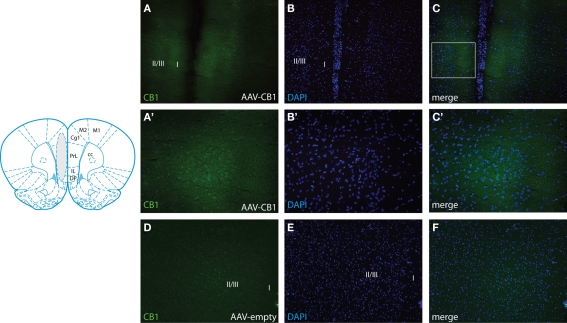
Figure 2.
Adeno-associated virus-mediated CB1 expression in the mPFC. The cartoon (adapted from Paxinos and Watson, 1998) shows the representative transduced area (gray) in animals injected with AAV-CB1. Representative immunostaining for CB1 in the mPFC of AAV-CB1-injected rats at low (10× for A–C) and high (20× for A′–C′) magnification. (A) Extent of CB1 immunoreactivity showing robust transduction in the target area. (B) Same section stained for the nuclear stain DAPI. (C) Overlay of (A) and (B). The box in (C) indicates the area magnified in (A′–C′). Note that adjustment of the exposure time for visualization of ectopic CB1 precludes visualization of endogenous CB1. The counterstaining with DAPI delineates the tissue and shows correct targeting of ectopic CB1 expression (C). (C′) High power micrograph showing CB1 immunoreactivity in the neuronal soma and neuropil of the mPFC. (D) Representative brain section (left hemisphere) of an AAV-Empty-injected animal showing endogenous CB1 immunoreactivity at low power (10×). Note that the exposure time was 2.5× more than for the visualization of transgenic CB1 shown in (A). (E) DAPI stain. (F) Merger of (D) and (E). Prl, prelimbic cortex; Cg1, area 1 of the cingulate cortex; IL, infralimbic cortex; DP, dorsal peduncular cortex; M1/2, motor cortex; cc, corpus callosum; I, II, III, cortical layers.

