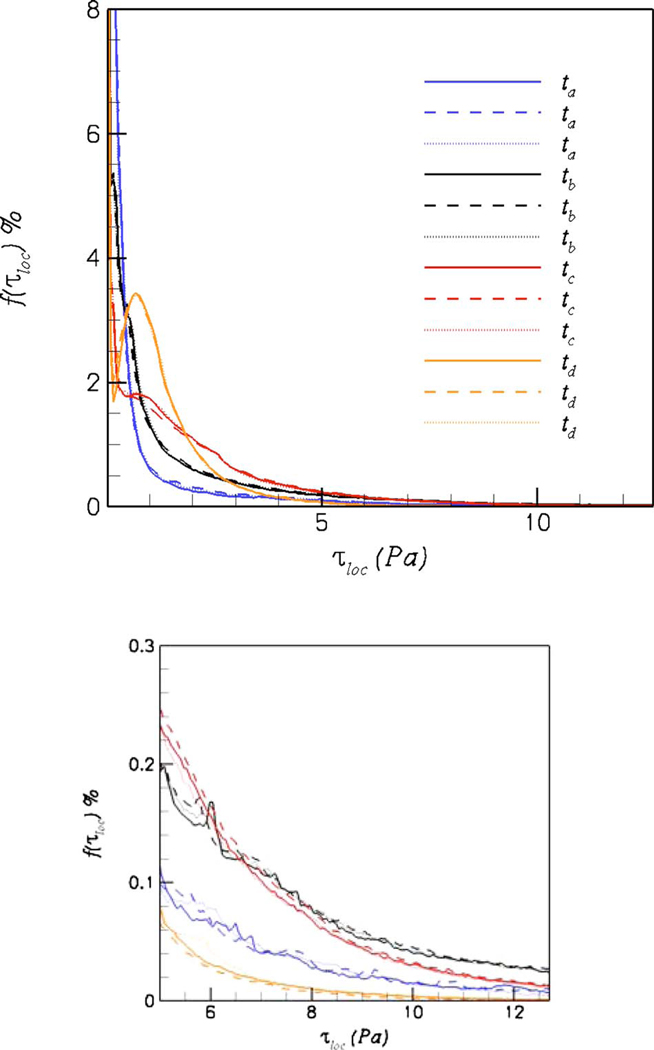
Fig. 7.
Histograms of local maximum shear τloc in the anatomic aorta for 0 deg (dotted lines), 45 deg (solid lines), and 90 deg (dashed lines) orientations. f is the percentile of the number of occurrences of a shear value τloc values in intervals with the width Δτloc=0.064 Pa to the total number of occurrences. a, b, c, etc., correspond to the time instant marked in Fig. 3 within the cardiac cycle.

