
Figure 1.
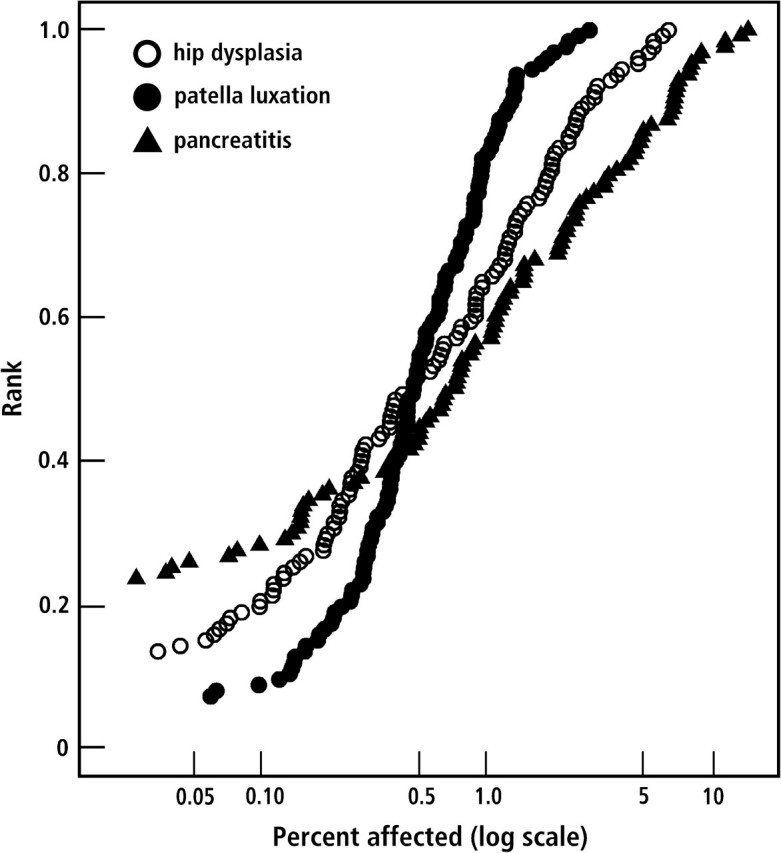
Disease frequencies are graphed as cumulative distributions (x axis, log scale) for hip dysplasia (open circles), patella luxation (closed circles), and pancreatitis (closed triangles). Records from 22 veterinary hospitals were obtained from the VMDB (see Methods). In all, 129 breeds were included that had records for more than 100 individuals. Cumulative rankings start at different places on the y axis corresponding to the number of breeds for which there were no diagnoses recorded for the disease—for example, 30 breeds without hip dysplasia, 17 breeds without patella luxation, and 9 breeds without pancreatitis.